Why Examine Carbon Footprints of Farms?
World Agriculture is currently faced with the challenge of feeding a rapidly increasing global population, predicted to peak at 9.2 billion by 2075, while meeting an obligation to reduce greenhouse gas (GHG) emissions. The emission of GHG can cause many serious problems, such as global temperature rise, sea level rise and ocean acidification.
 Agriculture releases significant amounts of CO2, CH4 and N2O to the atmosphere. It is estimated that the agriculture sector contributes around 10-12% (~ 5-6 Gt CO2-equivelents yr-1 in 2005) of total global anthropogenic GHG emissions, which is about 50 and 60% of methane and nitrous oxide emissions, respectively. UGA made a commitment to reduce the GHG emissions. These emissions are currently calculated using a model called campus-carbon-calculator. However this model is limited in agricultural applications because it does not account for many management changes that might reduce GHG emissions. The purpos e of our project was to select or develop a model for estimating the GHG emissions from UGA farms. It was necessary for this model to account for crop production, dairy production and swine production and desirable for the model to have limited data requirements, be easy to use and allow for a variety of management options to reduce GHG emissions.
What did we do?
We selected four models (Cool Farm Tool (Version 2.0), COMET-FARM Tool, Farm Smart (Version 1.5) and Pig Production Environmental Footprint Calculator (Version 3.X)) and also used the current-used model Clean Air-Cool Planet Campus Carbon Calculator (Version 6.9) to calculate GHG emissions on the UGA swine farm and dairy farm. We gathered inputs needed in both farms based on models with the help of farm managers, experts and references. Some inputs needed to be calculated and summarized and this was done using best available information. We entered information about swine farm into selected models and compared results on GHG emissions.
 What have we learned?
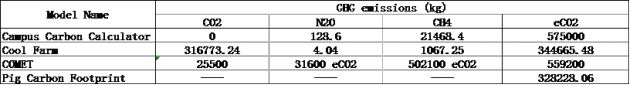
GHG emissions for the swine farm calculated using four different models are shown in Table 1. Estimates for GHG emissions in 2013 varied from 328228.06 kg CO2-equivalent (Pig Production Environmental Footprint Calculator (Version 3.X)) to 575000 kg CO2-equivalent using Clean Air-Cool Planet Campus Carbon Calculator (Version 6.9). While the Clean Air-Cool Planet Campus Carbon Calculator (Version 6.9) was the simplest one to use with only two inputs needed, it provided the highest estimates. Conversely, the Pig Production Environmental Footprint Calculator (Version 3.X) was the most complex and difficult to use but was the only tool that could adequately account for the anaerobic digester at this farm.
We will finish calculating GHG emissions on the dairy farm and compare models based on carbon footprints and time and effort required. We will investigate a variety of proposed management changes on both farms to determine the resulting impacts on carbon footprints.
Authors
Lin Ma, master student in Department of Crop and Soil Science, University of Georgia malin12@uga.edu
Mark Risse, professor in Department of Crop and Soil Science, University of Georgia
Additional Information
Cool Farm Tool (Version 2.0) https://app.coolfarmtool.org/account/login/?next=/
COMET-FARM Tool http://cometfarm.nrel.colostate.edu/
Farm Smart (Version 1.5) http://sites.usdairy.com/farmsmart/Pages/Home.aspx
Acknowledgements
Thanks to Drs. Lane Ely and Robert Dove and the employees and managers at the UGA Swine and Dairy Centers for supplying information and time to us for this effort.
The authors are solely responsible for the content of these proceedings. The technical information does not necessarily reflect the official position of the sponsoring agencies or institutions represented by planning committee members, and inclusion and distribution herein does not constitute an endorsement of views expressed by the same. Printed materials included herein are not refereed publications. Citations should appear as follows. EXAMPLE: Authors. 2015. Title of presentation. Waste to Worth: Spreading Science and Solutions. Seattle, WA. March 31-April 3, 2015. URL of this page. Accessed on: today’s date.