
Contents
- 1.1 What is color?
- 1.2 What factors affect the color of meat?
- 1.3 Can consumers tell the difference in pork color when the difference is small?
- 1.4 What color(s) will consumers accept/reject in pork?
- 1.5 Marbling and Consumer Attitudes Towards Fresh Pork
- 1.6 What is the effect of marbling on quality characteristics of pork?
- 1.7 What is the effect of marbling on consumer attitudes towards pork?
- 1.8 Implications
- 1.9 References
Originally published as a National Pork Board/ American Meat Science Association Fact Sheet.
Author:
M. Susan Brewer, University of Illinois
Reviewer:
Melvin Hunt, Kansas State University
Our eyes can differentiate among some 10,000,000 colors. Most of us learn colors by name before we learn to count. People with “normal” vision tend to see similarly; we do not have different thresholds for perception of color differences as they do for taste differences, and they can match colors in a similar way. What we see, as individuals, is very similar; what we think about what we see is quite variable based on our past experiences and on our expectations.
We use color, and other appearance characteristics, to judge whether or not we want to continue to interact with an object. Visual evaluation of an object requires no physical contact so it poses very little risk should something be unsafe; it also serves as a warning of danger (eg. red hot charcoal briquettes). We have color expectations—certain things are “supposed to be” certain colors; beef is supposed to be red, broccoli is supposed to be green. If we reverse the colors, green beef and red broccoli, these products become unacceptable. We won’t purchase them at the market because we are suspect of the quality or safety. This occurs, not necessarily because the food is unfit to eat but, because the color violates our expectation. Often minor color differences influence what we will, and won’t, eat–if the color of the food is even slightly off, we won’t eat it.
What is color?
Color is produced when energy in the visible range (400-700 nanometer long waves) is perceived by our eyes. The energy that produces color is contained in light. Pigments are molecules which absorb (subtract) some of the wavelengths from the light that illuminates an object. The wavelengths of the light which are absorbed, we don’t see; the wavelengths of light which are reflected produce the color we see. One of the most important concepts regarding color, is that in order for a color to be visible, it must be contained in the reflected light which means it must be present in the original light directed at the object. A red steak under a green light will not appear red because there are no red wavelengths in the original light directed at the steak which can be reflected back to the eye. Both the pigments in the product and the light which illuminates it determine what color the object appears.
Measuring color or color differences in meat products is one thing, but understanding what consumers like or dislike, will or won’t buy is quite another. Simply knowing a color difference exists tells us essentially nothing unless we have determined the preferred color range for a particular product. The latter must be determined by actually polling a large group of consumers. Even then, a number of factors, such as part of the country, age of the consumers, gender, etc. may impinge on the results. These factors can be accounted for, however they are part of the story of what consumers prefer.
What factors affect the color of meat?
The apparent color is affected by the amount of water in or on fresh meat. For example, proteins in meat with a low pH (<5.4) do not bind water very tightly. This “free water” in the tissues reflects light in many directions (scatters it) making the meat appear very light compared to higher pH meat in which water is more tightly bound. While these two pieces of meat may be the same color red, one may be much lighter (pale, soft exudative) than the other (dark, firm, dry), however, consumers often think one is more red than the other, and make purchase choices.
The color of red meat changes over time as the pigments bind oxygen then ultimately become oxidized to brown or grey. Color also changes due to microbial growth, cooking and exposure to various ingredients (vinegar, salt). However, the conditions known as “pale, soft and exudative” (PSE) and “dark firm and dry” (DFD) are particular problems in the pork industry due to certain genetics and types of pre- and postmortem handling. Pork which is brown or grey may be old or spoiled; pork which is pale may be tough and dry when cooked. Because color is an indicator of pork quality, consumers use it as a primary cue for making purchase decisions.
The color of red meat is affected by the presence (or absence) of oxygen in the surrounding environment. Normally, the purple-colored, reduced myoglobin form present in low oxygen tension environments blooms to a bright reddish-pink when meat tissue is exposed to oxygen. In a recent study consumers were asked to evaluate color and state their purchase intent for PSE, normal and DFD chops in PVC overwrap and in vacuum bags. The visual pink color differences between normal and very dark (DFD) pork loin chops in oxygen-permeable, PVC-overwrap were much larger than if the same chops were sealed in vacuum bags. However, very pale (PSE) pork chops had essentially the same visual color regardless of packaging. PSE pork appeared less wet when packaged in vacuum bags when than in PVC over-wrap. Packaging affected purchase intent of the chops differently; purchase intent was higher for DFD chops if they were vacuum packaged, however it was higher for PSE and normal pork chops packaged in PVC over-wrap. This may be due to color expectation as color of vacuum-packaged meat is expected to be darker. Color changes appear to have more effect on purchase intent of pale pork, while differences in surface wetness appear to be more of a factor in darker-colored pork.
Can consumers tell the difference in pork color when the difference is small?

In a recent study conducted in several local supermarkets, consumers were presented with over-wrapped, fresh pork loin chops which ranged from pale (1.0) to dark pink (5). Consumers had no difficulty discriminating among colors (Table 1). This is not surprising since we know that consumers can discriminate differences as small as 0.4 a* value units (instrumental measure of redness) in meat mixtures. Pork which is pale is often exudative and appears to have a wet surface. Consumers readily discerned surface wetness in the lighter colored samples even though the wetness differences were very small. Overall appearance acceptability was higher for the darker colored pork.
What color(s) will consumers accept/reject in pork?
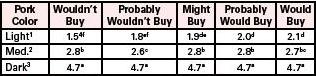
When consumers were asked whether they would buy the product they were looking at, some clear patterns were apparent. The pink color intensity remained relatively constant over all the purchase intent categories for both the darker and the intermediately pink pork. As purchase intent increased for the lighter-colored pork (from 1.6 to 4.0 on a 5-point scale), the visual color also increased, however purchase intent for dark-colored pork was nearly constant (4.7; Table 2). Small changes in perceived color (0.5 units) resulted in greater changes in purchase intent of lighter colored pork than did small color changes in darker colored pork. As might be expected, as purchase intent increased, appearance acceptability also increased; again, the change was most dramatic for the lightest pork. Light pork in the “wouldn’t buy” category had an appearance acceptability of 1.6; in the “would buy” category, the appearance acceptability was 4.1 . The appearance acceptability for medium and darker pork increased by less than 2 units as the chops moved from the “wouldn’t buy” to the “would buy” category (Table 2). Again, small changes in overall visual appearance acceptability made greater changes in purchase intent of lighter-colored pork than in darker-colored pork.
Marbling and Consumer Attitudes Towards Fresh Pork
According to the 1993 National Pork Producers Council Usage Study, consumers ranked their monthly consumption of fresh pork third behind beef and poultry. In 1993, consumer perception of pork appeared to relate to nutritional inferiority particularly in terms of fat, calories and cholesterol. The amount of visible fat may be the strongest visual cue for consumers as they consider purchasing pork, and that this first impression strongly reinforces the perception of pork being “bad for you”.
Whether consumers currently exhibit sensory preferences for more or less marbled pork in the retail case and when prepared for them or by them is unclear.
What is the effect of marbling on quality characteristics of pork?
- Breed lines known to produce more highly marbled lean have improved palatability.
- Increasing intramuscular fat from <1.5 to >3.5% increases flavor intensity and juiciness but has inconsistent effect on toughness
What is the effect of marbling on consumer attitudes towards pork?
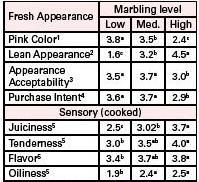
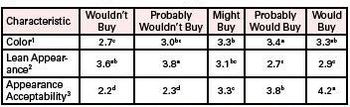
In a recent series of studies to evaluate the effects of marbling on attitudes towards pork loin chops, consumers chose packages of chops from a retail case containing 20-25 packages of the three marbling groups intermixed. Forty percent chose the lean (1.1% fat), 40% chose the medium (2.3%), and 20% chose the highly marbled (3.5%) chops as those they wanted to take home for their families. When presented with individual packages of chops and asked to evaluate color, leanness, overall appearance acceptability and purchase intent, clear trends were apparent. Highly marbled chops were lighter pink than leaner chops, and the presence of fat was clearly apparent (Table 3). Chops with a low or medium amount of marbling had higher appearance acceptability scores than did highly marbled chops; purchase intent followed the same trend. Given that 80% of this consumer group chose the lean or medium marbled chops to take home, and their demonstrated ability to visually discriminate among marbling levels, it seems both overall appearance acceptability and purchase intent are more highly driven by degree of marbling than by perceived color. However, loins chosen for this study were purposely selected for a minimum of lean color variation. When chops were prepared for consumers, highly marbled chops were most juicy and tender, and had higher flavor scores than did the leaner chops. In general, overall appearance acceptability most closely paralleled purchase intent of these chops (Table 4). On a 5-point scale, the range of the overall appearance acceptability between “wouldn’t buy” and “would buy” was less than 1 unit for leaner chops but was >2.5 units for highly marbled chops. Highly marbled chops in the “wouldn’t buy” category had less acceptable appearance, and those in the “would buy” category had more acceptable appearance than did the lean chops in the same purchase intent categories. This indicates that lean chops did not have to be as visually acceptable as the medium or lean chops to be placed in the highest purchase intent category. Consumers returning the inhome preparation survey indicated that >80% purchase pork for consumption at home because they like it, 35% because the cost is right, 24% because of the nutritional value and 48% because it is easy to prepare. When they eat pork away from home, results were similar; additionally, >32% did so because it was prepared in a way they couldn’t or don’t. More than 46% indicated that someone in their household restricts their dietary fat intake. More than 75% think loin chops have less fat than beef prime rib while 21% think it has about the same amount; 38% think loin chops have less fat than chicken thigh meat while 48% think they are about the same.

When chops chosen by the consumers were prepared at home, the marbling-related differences in sensory attributes which occurred when they evaluated the chops prepared for them disappeared (Table 5). Juiciness, tenderness, and flavor intensity means were >4.0 for chops in the highest purchase intent category. This was true regardless of marbling category. Juiciness increased the most and flavor intensity increased the least from the lowest to the highest purchase intent category. Very few of the chops evaluated at home were in the “would not buy” category. Marbling category appeared to have less effect on purchase intent than did tenderness, juiciness and flavor. When evaluated at home, consumers rated the chops they chose as being more tender, juicy and flavorful than samples which they evaluated “blind” from the same marbling category which were prepared for them by laboratory personnel.
This suggests that additional psychological factors, such as expectation satisfaction, must have a significant impact on stated purchase intent when it is based on characteristics of chops evaluated at home.
Implications
Measuring meat color, either instrumentally or visually, is relatively straight forward: both instruments and people are capable of discriminating relatively small color differences. Determining which color is associated with “purchase intent” is much more difficult since other characteristics are part of the purchase intent decision. In general, consumers say they are more likely to buy darkcolored pork than light-colored pork.
The presence of visible fat within the lean tissue can send more than one message to consumers: the product is high in fat, and it may be more tender, juicy and flavorful. In a recent study where consumers chose chops from a retail case which they took home for their families to evaluate, 40% chose lean chops while only 20% chose the highly marbled chops. Consumers were able to the tell the difference in color, leanness, tenderness , juiciness and flavor, and the more highly marbled chops were more tender, juicy and flavorful. When they evaluated these same chops at home, the chops were given higher ratings for all attributes, regardless of degree of marbling, than they had when chops cooked by laboratory staff were evaluated. Lean appearance seems to drive purchase intent (when color is approximately the same), but once the chops have been purchased, the quality of all chop choices is likely to be judged as very high when they are consumed at home. This implies that satisfying the expectations which a consumer has coming into the store may be much more of a factor in stated purchase intent than any of the individual attributes.
References
Brewer, M.S. and McKeith, F.K. 1999a. Consumer-rated quality characteristics as related to purchase intent of fresh pork. J. Food Sci. 64(1):171- 174.
Brewer, M.S., Zhu, L.G., and McKeith.1999b. Marbling effects on consumer quality characteristics of pork. II. Purchase intent and characteristics of on-site and in-home prepared loin chops. Proc. 52nd Ann. Recip. Meat Conf., Stillwater, OK., June 20-24.
Brewer, M.S., Lan, H.-Y., and McKeith, F.K. 1998. Consumer evaluations of pork appearance with differing physiological and packaging conditions. J. Muscle Foods. 9:173-183.
Ellis, M.., Webb, A.J., Avery, P.J. and Brown, I. 1996.The influence of terminal sire genotype, sex, slaughter weight, feeding regimen and slaughter house on growth performance, and carcass and meat quality in pigs and on the organoleptic properties of fresh pork. J. Anim. Sci. 74:521-530..
Fernandez, X., Monin, G., Talmont, A., Mourot, J. and Lebret, B. 1999. Influence of intramuscular fat content on the quality of pig meat–2. Consumer acceptability of m. longissimus lumborum. Meat Sci. 53:67-72
Levy, S. and Hanna, M. 1994. Consumer Quality Audit Summary. National Pork Producers Council. Des Moines, IA.
Meisinger, D.J., McKeith, F.K., Forrest, J., Morgan, M., and Brewer, M.S. 1999. New NPPC color and marbling standards. Proc. 52nd Annual Recip. Meat Conf., Stillwater,OK, June 20-24.
NPPC/MARC. 1993. Meat Attitude Perception Tracker. National Pork Producers Council. Des Moines, IA.
Zhu, L. G. and Brewer, M.S. 1999. Relationship between instrumental and visual color in a raw, fresh beef and chicken model system. J. Muscle Foods. 10:131-146.
Table 1 – Instrumental color (L*, a*, b* values ) and visual color of light, medium and dark pink loin pork chops (Brewer and McKeith, 1999). 11=very wet, 5=very dry; 21=very light, 5=very dark; 31=very unacceptable appearance, 5=very acceptable appearance; abcMeans with different superscript letters are different (p<0.05).
Table 2 – Visual “pink color intensity” of pork chops in various purchase intent categories (Brewer and McKeith, 1999). 1L*=56.96; 2L*=51.51; 3L*=38.00; 4Color means in that category: 1=very light, 5=very dark; abcdefMeans with different superscript letters are different (p<0.05).
Table 3 – Marbling effects on consumer evaluations of on-site prepared pork chops. (Brewer et al., 1999a). 11=very light pink, 5=dark pink; 21=very lean, 5=highly marbled; 31=very unacceptable, 5=very acceptable; 41=wouldn’t buy, 5=would buy; 51=not at all, 5=very much; abc Means with different superscript letters are different (p<0.05).
Table 4 – Appearance of chops in each purchase intent category (Brewer et al., 1999a). 11=very light, 5=dark; 21=very lean, 5=highly marbled; 31=very unacceptable, 5=very unacceptable; abcdMeans with different superscript letters are different (p<0.05).
Table 5 – Marbling effects on sensory characteristics of pork chops prepared at home. (Brewer et al., 1999b). 11=not at all juicy, 5=very juicy; 21=not at all tender, 5=very tender; 31=not at all flavorful, 5=very flavorful; 41=not at all oily, 5=very oily; 51=definitely would not buy, 5=definitely would buy; 6Low=1.1% fat, medium=2.3%, high=3.5%