Originally published as PIH-112.
Authors:
Allen Harper, Virginia Tech;
Dale Forsyth, Purdue University
Reviewers:
Gary Parker, University of Kentucky;
Gerald Shurson, University of Minnesota
In the U.S., supplies of competitively priced corn and soybean meal have been readily available through recent decades, so it is reasonable that these feedstuffs are the predominant ingredients used in swine diet formulation. However, a vast amount of swine feeding research and production experience has demonstrated that nutritional requirements of swine can be met with a variety of feed ingredients including alternative grains and oilseeds, grain milling by-products, food and beverage industry byproducts, animal processing by-products, and others.
Feed ingredient prices change as markets respond to the forces of supply and demand. The relative value of alternative feeds for swine diet formulation is important because feed costs account for 60% to 70% of production costs and thus have a major impact on profitability. Pork producers willing to effectively compare the value of potential ingredients and appropriately utilize the best alternatives when appropriate can realize increased profit through decreased feed costs. This is particularly true for large scale producers and feed manufacturers with the capacity to procure and store many different ingredients. Moderate and small scale producers and feed mills also can realize benefits from assessing the relative values of ingredients, although the type and quantity of alternative feeds considered for use may be more limited. Least-cost diet formulation programs offer the most common method used to make value comparisons. However, the method described in this fact sheet is simpler and provides an accurate indication of feedstuff value.
When assessing the value of alternative feeds for swine, it is important to recognize that some feeds may have negative properties that limit the quantity that can be effectively included in diet formulations. For example, oats is a feed grain that has greater protein content than corn but the relatively high fiber content of oats reduces energy digestibility. Excessive dietary levels of oats can cause the finished feed to be bulky and physically difficult to handle. PIH 07-02-02, Dietary Energy for Swine, provides information on maximum inclusion rates for a variety of alternative energy and protein feed sources. Assuming that limitations on inclusion rates for certain ingredients are adhered to, alternative feedstuffs value assessment can be used for cost effective diet formulation.
What Comprises Value in a Swine Feedstuff?
In order of cost contribution to the diet, energy, protein (essential amino acids), and available phosphorus are the three most costly components in a complete swine feed. If feeds are compared considering their contributions of energy, protein, and phosphorus they will be ranked in a manner similar to a least-cost solution. Energy must be supplied in the greatest quantity and represents the largest cost contribution to the finished diet. Energy value of ingredients has particular importance because dietary energy levels must be adequate to fuel growth, reproductive function, and milk production. Within limits, swine provided ad libitum access to feed can compensate for lower dietary energy levels by voluntarily consuming more feed. Under this circumstance, growth rate may remain stable but feed efficiency will be reduced when feeding a lower energy diet. The energy requirement of pigs and the energy value of feeds typically is expressed as metabolizable energy (ME) which represents total energy minus energy lost in the feces and urine.
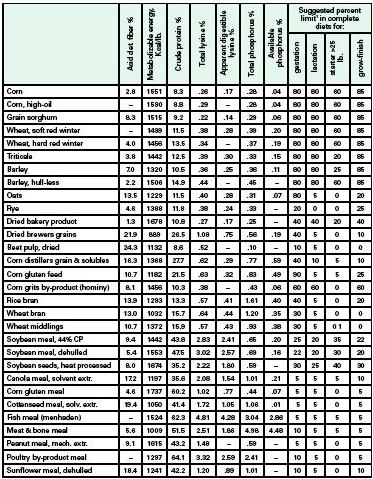
Cereal grains are the primary energy-contributing ingredients for swine diets. Table 1 shows published (NRC 1998) metabolizable energy values for selected grains and grain by-products. Note that on an air-dry, asfed basis, feeds with higher fiber content generally will contain less ME for swine and thus have lower relative value for diet formulation. For example, barley grain typically has about twice as much fiber as corn and considerably less metabolizable energy than corn.
The second largest contributor to the cost of swine diets is protein, or more specifically, the source of essential amino acids required by swine. For most grain and oilseed mealbased diets, lysine is the most limiting amino acid. For this reason, swine diets typically are formulated to insure that the pig’s lysine requirement is met with the knowledge that other amino acids such as tryptophan, threonine, and methionine will be fed at levels slightly above the requirement. Because the total lysine content of feeds is not 100 percent available to pigs, diets can be formulated to more accurately meet lysine requirements when the digestible lysine requirement of the pig is used as the formulation criterion. Reliable data on the apparent digestibility of lysine for swine are available for many, but not all, potential swine feed ingredients (Table 1).
Phosphorus represents the third most significant expense to a swine diet due primarily to the need for inorganic phosphate supplements such as dicalcium phosphate (18.5% available phosphorus), monodicalcium phosphate (21% available phosphorus), or defluorinated phosphate (17% available phosphorus). Adding these phosphorus supplements can contribute in the range of $2.00 to $4.00 additional cost per ton of finished feed. Energy and protein sources that also contribute significant quantities of available phosphorus to the final diet add value because less inorganic phosphate supplement is required. Available phosphorus is important because much of the total phosphorus in grains and oilseeds is bound as phytate. Unless the enzyme phytase is supplemented in the diet, most of the phytatebound phosphorus in feeds is not available to the pig. Unfortunately reliable estimates of phosphorus availability have been determined for only a limited number of typical swine feed ingredients (Table 1); total phosphorus content estimates are available for most feedstuffs that may be used in swine diets.
Calculating and Comparing Relative Value of Feedstuffs
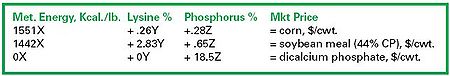
One method that has been used to determine the relative value of swine feedstuffs is to solve simultaneous equations to estimate the value of metabolizable energy, lysine, and phosphorus in three reference feeds with known market prices which are typically used in the diet. The value of each component may then be applied to alternative feedstuffs to estimate value of the potential alternative feed relative to the reference feed values. The three reference feeds would include a principle energy source (usually corn), a source of essential amino acids (usually soybean meal), and a supplemental phosphorus source such as dicalcium phosphate. The simultaneous equations for these reference feeds can be written as follows:
By solving for X (the value coefficient for Met. Energy), Y (the value coefficient for |lysine), and Z (the value coefficient for phosphorus), one may calculate the relative total value of an alternative feed by applying the appropriate coefficient to the metabolizable energy, lysine, and phosphorus levels in the alternative feed and then summing the values to estimate the relative value per hundredweight.
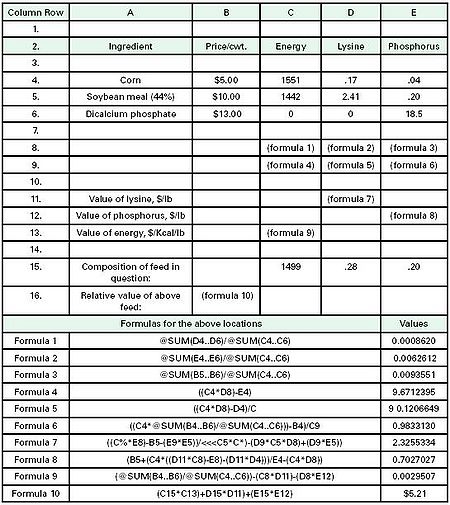
The simultaneous equations above would be appropriate if reliable estimates of apparent digestible lysine or available phosphorus were not available. However, if apparent digestible lysine and available phosphorus values for the alternative feed in question were available (Table 1), then a more accurate assessment could be made by substituting digestible lysine and available phosphorus in place of total values. Regardless of whether total, digestible, or available figures are used, it is important that the nutrient values be consistent for the reference feeds and the alternative feed being evaluated. Solving these simultaneous equations in computer spreadsheet programs offers a means to rapidly calculate the relative value of alternative feeds, depending on the composition and prices of reference feeds. Computer spreadsheet formulas to solve the simultaneous equations are given in Table 2. The spread-sheet program may be downloaded at no cost from http://www.ansc. purdue.edu/compute/subvalue. htm. It should be noted that neither this method nor linear programming (leastcost) methods assign additional value to high energy feeds based on the potential for improvements in feed efficiency with higher energy diets. Rather this method assigns value to the metabolizable energy content of feeds with the assumption that feed efficiency will be similar for complete diets that contain similar energy levels.
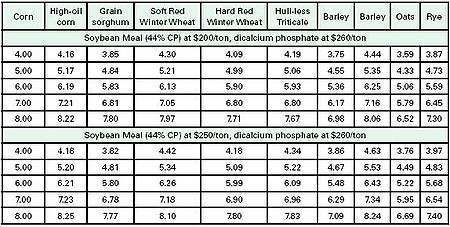
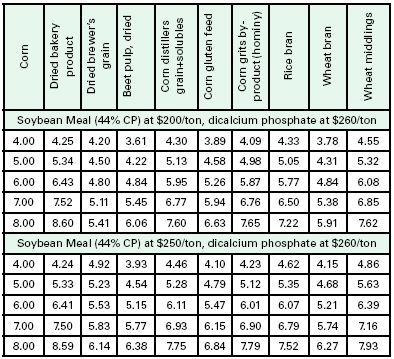
Table 3 illustrates relative value estimates for selected feed grains and Table 4 show relative values for selected grain by-products when corn, 54% protein soybean meal, and dicalcium phosphate are used as the reference price feeds. In these tables, values are given for situations in which corn is priced from $4- 8.00 per hundredweight ($2.24 to $4.48/bu.), soybean meal is priced at $200 or $250 per ton, and dicalcium phosphate is priced at $260 per ton. All values generated for the table are expressed on an equal weight basis ($/cwt.). This is important because bushel weights vary substantially among feed grains and thus would not allow for accurate price comparisons for different grains. Once relative values per cwt. Are determined, appropriate standard bushel weights for feed grains can be used to calculate relative value based on price per bushel.
Feed grains that contain similar or higher metabolizable energy levels, higher digestible lysine, and higher available phosphorus levels than corn will be valued somewhat higher than corn on an equal weight basis. For example, soft red winter wheat has slightly less metabolizable energy than corn but higher digestible lysine and available phosphorus than corn. When soybean meal is priced at $200 per ton and corn is priced at $5.00 per cwt. ($2.80/bu.) then soft red winter wheat is valued at $5.21 per cwt. ($3.12/ bu.) (Table 3). Under this scenario, if soft red winter wheat can be purchased for less than $5.21 per cwt., it is more cost effective to include more wheat and less corn in the diet formulation. These relative value estimates hold true assuming that diets are formulated properly and the maximum inclusion rate limits indicated in Table 1 are not exceeded.
This method is equally valid for determining relative value estimates for high protein feedstuffs. In this case the producer or feed formulator is more interested in the relative value of the alternative feed as compared to a standard protein source such as soybean meal.
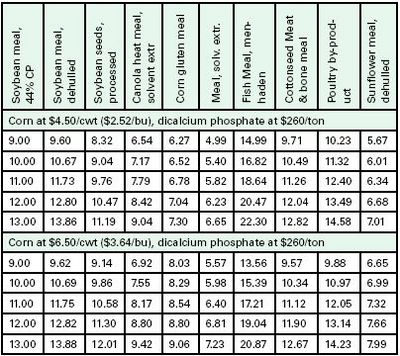
Table 5 illustrates the relative values of selected protein sources when 44% protein soybean meal, corn, and dicalcium phosphate are used as reference price feeds. In this table 44 % protein soybean meal is priced over a range of $9.00 to $13.00 per cwt. ($180 to $260 per ton), corn is priced at $4.50 or $6.50 per cwt. ($2.52 or $3.64/bu.), and dicalcium phosphate is priced at $260 per ton. As indicated a protein source such as dehulled soybean meal (48% CP) which is higher in energy and digestible lysine than standard soybean meal (44%LP) will have higher relative value per cwt. than 44%LP soybean meal. Conversely, a protein source with less energy and digestible lysine such as canola meal will have less value when compared to soybean meal.
Related Publications
PIH-07-02-02 Dietary Energy for Swine
PIH-07-01-03 Principles of Balancing a Swine Ration
PIH-07-01-04 Swine Diets
Table 1. Composition of selected cereal grains, byproduct feeds and protein sources for swine. Composition data adapted from NRC (1998) Nutrient Requirements of Swine, tenth revised edition. Values are on an air dry (88-94% DM), as-fed basis. 1Suggested limits taken principally from PIH-3, Dietary Energy for Swine (Holden, Shurson and Pettigrew, 1991).
Table 2. Spreadsheet program for use with personal computers. After PIH-112 , revised 11 /87. E.J. Stevermer, C.R. Hamilton, N.T. Moreng, M.J. Parsons, and T.D. Tanksley, Jr., authors. The example is shown for soft red winter wheat.
Table 3. Estimated value in $/cwt of feed grains for swine using corn, soybean meal (44% CP), and dicalcium phosphate asreference price feedstuffs. Relative values are based on solving for value coefficients X (metabolizable energy), Y (lysine or digestible lysine), and Z (phosphorus or available phosphorus) using simultaneous equations with the reference feeds, then applying the value of X, Y, and Z coefficients to the composition of the feed in question.
Table 4. Estimated value in $/cwt of by-product feeds for swine using corn, soybean meal (44% CP), and dicalciumphosphate as reference price feedstuffs. Relative values are based on solving for value coefficients X (metabolizable energy), Y (lysine or digestible lysine), and Z (phosphorus or available phosphorus) usingsimultaneous equations with the reference feeds, then applying the value of X, Y, and Z coefficients to the composition of the feed in question.
Table 5. Estimated value in $/cwt of protein feed sources for swine using soybean meal (44% CP), corn, and dicalcium phosphate as reference price feedstuffs. Relative values are based on solving for value coefficients X (metabolizable energy), Y (lysine or digestible lysine), and Z (phosphorus or available simultaneous equations with the reference feeds, then applying the value of X, Y, and Z coefficients to the composition of the feed in question.