Originally published as PIH-119.
Authors: Gene A. Futrell, Iowa State University; Allan G. Mueller, University of Illinois; Glenn Grimes, University of Missouri
Reviewers: John Dunbar, University of California; Larry and Mary Metz, London, Arkansas; W. Randy Walker, University of Florida; Richard L. Trimble, University of Kentucky
Hog production and price cycles have been a part of the U.S. hog industry ever since hogs became a major enterprise in U.S. agriculture. Hog cycles are recurring changes in production and/or prices which are a year or more in length. A complete cycle includes successive years of increase and decrease in either hog production or prices extending from one peak (or valley) to the next peak (or valley). This is in contrast to seasonal patterns, which are recurring production or price changes that take place within a year.
Hog Production Cycles
Hog production cycles exist primarily because hog producers respond to changing economic conditions in the hog business. When hogs have been profitable for awhile, producers as a group begin to expand production to take advantage of the expected profit opportunity. In the very early stages of expansion, the increase in gilt holdback may further reduce slaughter temporarily and add to the price strength. Expansion typically continues until larger supplies cause prices to drop to unprofitable levels for most producers. Some producers respond by either cutting back on their production or by leaving the hog business. Liquidation of sows and smaller gilt retention add to slaughter supplies as the expansion phase of the cycle ends. As a smaller breeding herd is later reflected in smaller supplies of pork, prices normally trend higher again, profits improve and the stage is set for another period of cyclical expansion.
Hog prices are not the only determinant of profitability. Changes in production costs, particularly of feed, also affect profitability and can contribute to cyclical production trends. Usually, there is a considerable time lag from when hog producers begin to respond to changes in hog profitability until there are actual changes in the level of pork production. It takes nine to ten months after breeding before additional hogs can be put on the market. Prior to that, additional time is required for a producer to obtain more breeding stock after a decision to increase farrowings has been made. And a decision to expand or to enter the hog business is not usually made immediately when hog returns become favorable. Three to six months of favorable profits are normally required before general expansion of the breeding herd takes place.
Decreases in hog production can potentially take place more rapidly than expansion. And the cyclical downtrend in production is usually shorter than the expansion phase. But as in the case of expansion, hog producers are often reluctant to quickly reduce their breeding herds, particularly when there is a major commitment to hog production through facility investment and enterprise specialization. It may take several months of unfavorable returns before there is an industrywide reduction in sow farrowings. Then it is an additional five or six months before pork production turns down.

Figure 1 illustrates the cyclical patterns of U.S. hog production and sow farrowings since 1949. The cycles have not been highly consistent in terms of length and magnitude, but a cyclical pattern has continued to be characteristic of the industry.


Table 1 and Figures 2a and 2b provide a closer look at the individual production cycles since 1950, based on annual liveweight production. Figure 2a includes the cycles from 1950 through 1965 and Figure 2b shows the cycles since 1965. From 1950 to 1987, there were either eight or nine complete production cycles, depending upon whether the 1975-82 period is considered one cycle or two cycles. Sow farrowings declined slightly in 1978, indicating the bottom of a three-year cycle. Hog production, however, increased slightly in 1978 continuing the expansion started in 1976. In Figure 2b, the period is plotted as one long cycle, based on pork production, but it might also be considered essentially a three-year cycle from 1975 to 1978 and a four-year cycle from 1978 through 1982.
The average length of the cycles in this period was 4 years, including both expansion and cutback phases. The production cycles have varied in length from three to as many as seven years for a full cycle. The most frequent cycle length has been four years, with three of this duration since 1950. There have been two production cycles of three years in length and one cycle each of five, six and seven years.
The expansion phase of the cycle has varied more in length than the contraction or cutback phase (Table 1). The expansion phase of production cycles from 1950 through 1986 varied from one to five years, with two years the most frequent length. The average length of the expansion phase was 2.4 years and the average length of the cutback phase was 2.1 years.
An important characteristic of the hog production cycle since 1950 is that only two cutback phases lasted more than two years. Four of the cycles had two years of declining production and two had only one year of downtrend.
Hog-Corn Ratio
Since feed is a major cost of production, one historical indicator of hog profitability and of cyclical change in production and price is the hog-corn ratio. This measures the relationship between hog and corn prices and is the number of bushels of corn that it takes to equal the value of 100 pounds of live hog. Specifically, it is the price of hogs ($ per cwt.) divided by the price of corn ($ per bushel). When the hog-corn ratio is higher than average, producers tend to respond by breeding more sows and producing more hogs. When the ratio is lower than average, producers usually respond by cutting back hog production.
In the 1950’s and early 1960’s, the hog-corn ratio averaged around 14.0 to 1. When the ratio was above this level, producers tended to expand production; and when it was lower, production decreased. From the late 1960’s to mid-1980’s, however, the hog-corn ratio averaged around 18 to 1. This now appears to be the pivotal level for either expansion or production cutback. The historical relationship between the hog-corn ratio and the subsequent change in sow farrowings is shown in Figure 3.

In 1986 and 1987, the hog-corn ratio reached new historic highs in the 35 to 43 to 1 range at times, as corn prices dropped sharply and hog prices were at historically high levels. These ratios, however, did not represent the actual value of corn to many hog producers who participated in the government feed grain program. Market prices were lowered by “pik and roll” transactions with Payment-In-Commodity Certificates, often called PIK certificates. The value of corn to most producers was raised substantially by PIK returns and deficiency payments.
The main reason that the hog-corn ratio has moved to a higher level in more recent years is because of changes in the cost structure of hog production, i.e. the relative cost of the major items that go into hog production. The cost of corn is relatively less than it used to be, with protein feeds and nonfeed costs such as buildings, equipment, and labor making up more of the total costs than during earlier years. Since the ratio reflects only the price of one input (corn), it fails to reflect the price changes in other inputs and a higher hog-corn ratio is needed to cover other costs of production.
A major limitation of the hog-corn ratio as a profit indicator is that the price ratio that will cover all production costs varies with the price of corn. In general, it takes a higher hog-corn ratio to represent a profitable situation when corn prices are low than when they are high. It may take a ratio of only 17 to 1 to be profitable when corn is $3.00 per bushel; but at $1.50 per bushel, a ratio of 19 or 20 to 1 may be needed to indicate similar profitability— assuming nonfeed costs, including fixed costs, have remained fairly stable. With greater corn price variability since the early 1970’s, the hog-corn ratio does not measure hog profitability as well as during earlier years.
Hog Price Cycles
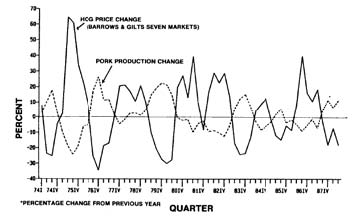
Hog price cycles are defined in the same general way as production cycles, but they illustrate uptrends and downtrends in price. At the beginning of a cycle, hog prices begin to rise and the cycle continues until the price peaks and the subsequent price decline ends. Price cycles are almost the exact opposite of the production cycles. When hog production is rising, hog prices are normally trending down; and when hog production is declining, hog prices are usually trending up. This general relationship between hog production and price cycles is illustrated in Figure 4.


Table 2, Figures 5a, and 5b provide a detailed look at the hog price cycles since 1950. In general, price cycles in this period have been shorter than the production cycles. While production cycles from 1950 through 1985 averaged 4.5 years in length, the average length of price cycles was only three years. There were 12 price cycles from 1950 to 1985, with another cycle still in progress in 1988. The length of the cycles varied from two to five years, with three years the most frequent length. There were six cycles of three years, four two-year cycles, and one each of four and five years. There were six cycles when the uptrend phase lasted two years, with one-year uptrends in the other cycles. The downtrend phase of the price cycles varied in length from one to three years, lasting only one year in eight of the cycles.
Profit Variability
Although the hog-corn ratio is often used as an indicator of hog profitability, producers likely base their production response on their perception of recent and expected actual profitability. Consistent monthly or quarterly data on hog returns over a long period of time are not widely available, however, this kind of data series has been developed at some land-grant universities.

The profitability of farrow/finish hog operations has fluctuated a great deal over the past 20 years. The pattern of profit variability, however, has not been very consistent, as shown by Iowa estimates of profitability in Figure 6. There have been several periods of extended profits since 1970 and three periods when losses were general for from 9 to 12 months. There have also been numerous shorter periods of profit or loss. The period from early 1984 through early 1986 was characterized by alternating short periods of profit and loss, that was followed by a prolonged period of profitability from the spring of 1986 into 1988.
Will Hog Cycles Continue?
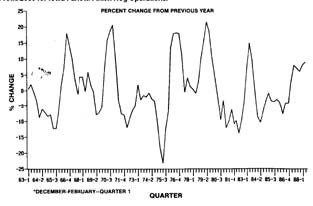
For many years there have been forecasts that structural changes in the hog industry would cause the hog production cycle to largely disappear. The average size of hog operations has continued to increase. And there are more high-investment, specialized hog operations. These operations may have less flexibility in making production changes and are more likely to maintain a fairly stable output, except when major facility additions are made or prolonged poor returns cause them to discontinue production. But despite larger size units and increasing specialization and commercialization of hog production, sow farrowings have continued to show quite a bit of year to year variation. The industry still appears to be responsive to changes in either hog profitability or to profit opportunities from other uses of resources. This ability to vary production significantly is illustrated in Figure 7, which shows percentage changes in quarterly sow farrowings from year earlier quarters.
The trend to larger hog operations and to some increase in contract production of hogs should add some stability to the hog industry. However, a significant proportion of total hog output still comes from small and moderate sized operations. Most of it comes from independent operations rather than from integrated and contract production units. And many of the large operations have flexibility for moderate variations in facility utilization and production levels.
Cycles may become somewhat longer, with cutbacks occurring only after prolonged periods of very poor returns. And major expansions may take place only after extended periods of favorable profits, as in 1986- 87. Over time, changes in production technology and the pork industry structure may change the nature of the hog production cycle. But for the next few years, it appears likely that the industry will continue to show at least moderate production and price cycles of somewhat variable length.
Using Price and Production Cycles in Marketing and Planning
Cyclical price patterns can be used to help determine when to market or to price hogs. During the declining phase of the hog price cycle, a producer should consider marketing hogs at lighter than normal weights, since any delay in marketing may result in a lower price. Therefore, a tendency to earlier marketing of hogs should improve returns. In the uptrend phase of the hog price cycle, hogs can often be profitably marketed at heavier weights or marketing delayed longer than normal. Not only will the hogs tend to bring higher prices, but usually when hog prices are rising as a result of reduced pork supply, price discounts for heavier weights become smaller or begin at heavier weights.
The phase of production and price cycles should also be considered in developing forward pricing strategies for use of cash contracts, futures, or option contracts. Early anticipation of the general trend in prices can be a guide to appropriate price risk management strategies and decisions. Thus, downside price protection may be especially important when a cyclical uptrend in production (price downtrend) is developing. If a price uptrend seems to be developing cash or option pricing strategies may be more appropriate.
The price cycle should not be used in isolation from the seasonal hog-price pattern. Obviously, when both the seasonal and cyclical patterns indicate declining prices, marketing at a lighter weight is important. Also when both the cyclical and seasonal price patterns indicate rising prices, marketing at heavier weights can increase net returns.
Production and price cycles can also be used as guidelines for annual production decisions of individual producers. Individual producers, for example, may decide to moderately reduce their production level when production is expanding industry-wide. And they may prepare to expand, within the limits of facility constraints, when industry production is trending down cyclically. In a similar way, production and price cycles can be an important consideration in the timing of decisions on facility improvements, new facility construction, or general expansion of the hog operation. Investment in new facilities or in facility expansion, for example, might be planned so that the initial new output flow coincides as closely as possible with the upturn phase of the price cycle.
Table 1. Hog Production Cycles. Average length of production cycles, 1950-86: 4.5 years. Average length of increased production, 1950-86: 2.4 years. Average length of decreased production, 1950-86: 2.1 years.
Table 1. Hog Price Cycles. Average length of price cycles, 1950-85: 2.9 years. Average length of price increase, 1950-85: 1.5 years. Average length of price decrease, 1950-85: 1.4 years.
Figure 1. Annual Farrowings and Pork Production in the U.S.
Figures 2a and 2b. Hog Production Cycles (Liveweight Pork Production).
Figure 3. Farrowing change and Hog/Corn Price Ratio
Figure 4. Changes in Hog Prices and Pork Production.
Figure 5a. Hog Price Cycles (Barrows & Gilts 7 Markets)
Figure 5b. Hog Price Cycles (Barrows & Gilts 7 Markets)
Figure 6. Profit/Loss for Iowa Farrow/Finish Hog Operations.
Figure 7. Sow Farrowings by Quarters.